Failures
When a fragment, gadget, macro or UI modification fails, Script Master tells the people using it in plain words. It also records the failure for you. This page explains what people see, where you find the failures, and how they're counted.
Web triggers, scheduled jobs and post functions run on a server. Their failures are in their run history.
What is recorded
Fragments, gadgets and macros run in the viewer's browser. Script Master records a failure when:
- The code throws an error, or a promise fails without being handled.
- The content doesn't finish loading within 20 seconds.
For an error in a script loaded from another site, the browser gives no details. The record then says that an external script failed.
UI modifications record the failures that Jira's forms report. See UI Modifications.
What people see
What the message says depends on who is looking and whether anything showed.
| Situation | People who aren't admins | Jira admins and Confluence admins |
|---|---|---|
| Nothing showed | This panel couldn't load. and Your Jira admin has been told., with Try again | This panel failed at line 3, the error, the note Only Jira admins see these details. Other people see "This panel couldn't load." The failure is recorded in Script Master., Open in Script Master and Try again |
| Part of the content showed | A line above it: Part of this panel didn't work. Your Jira admin has been told., with Try again | A line above it with the line number and the error, and Open in Script Master |
| Didn't finish loading within 20 seconds | Nothing | The panel didn't finish loading within 20 seconds. |
The message names what the viewer is looking at: a panel, an action, a gadget, a macro, an item or a page. In Confluence it says Confluence admin.
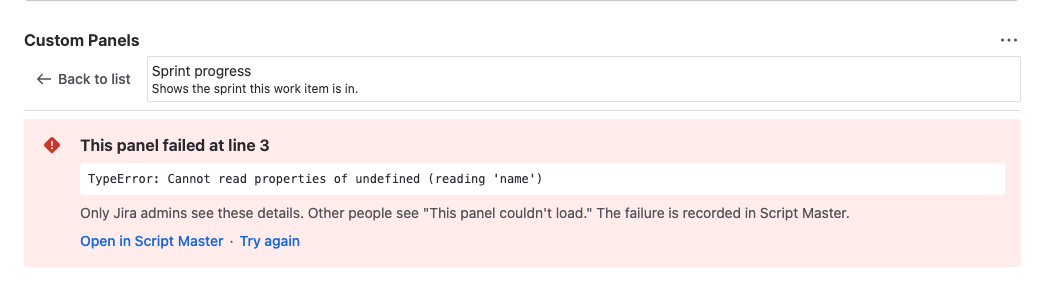
Open in Script Master opens the item's editor in a new browser tab.
Where you see failures
- The list. Fragments, gadgets, macros and UI modifications have a Failures column. It shows a count such as 3 failures, or None. Hover over the count for the last failure. The Failing filter shows only failing items.
- The editor. A failing item's editor shows Failed 3 times since and a date, with the last error and its line. Go to line 12 jumps to that line in the code.
- The Overview. Failing items that are on appear under Needs attention. See The Overview tab.
- The Last 7 days column. It shows failures per day. See Run history and activity.
- Version history. Each version shows how often its code failed while it was live. See Version history.

Clear a failure record
Clear the record when you've dealt with the cause, so new failures stand out.
- Open the failing item's editor.
- In the failure banner, select Clear.
Result: The banner goes away and the item shows None in the Failures column. It appears again on its next failure.
You can also select Clear on the item's row under Needs attention on the Overview.
Saving changed code clears the record too. The count always covers the code since its last change.
How failures are counted
- At most one failure is recorded every 5 minutes per item. The count is a lower bound: the item may have failed more often.
- Each browser reports the same version of an item at most once every 10 minutes.
- Views that work write nothing.
- The error message is kept to 300 characters. Before it's stored, anything that looks like a token, a key, a long random string or an email address is replaced with
[redacted]. - Deleting an item deletes its failure record.
Related
- Run history and activity: runs of server scripts, and failures per day.
- The Overview tab: every failing item on one page.
- Version history: go back to code that worked.
- Fragments: build fragments and test them in the live preview.